What are the S2S4E case studies?
Earlier in the S2S4E project, eight case studies have been selected to provide real-world examples which demonstrate the potential of the forecasts used in the Decision Support Tool (DST). The eight historical case studies have been selected as most relevant by industrial partners, due to unusual climate behaviour affecting the energy market.
The case studies present extreme events that occurred in the past and evaluate S2S4E forecasts that potentially could have been available, to see if they could have added value to decision-making for the energy sector in preparation for these extreme events. These case studies were originally identified in Deliverable 2.1, analysed from the climatological point of view in Deliverable 4.1 and these factsheets, and from the economic perspective in Deliverable 2.2.
Factsheets created to summarise the case studies
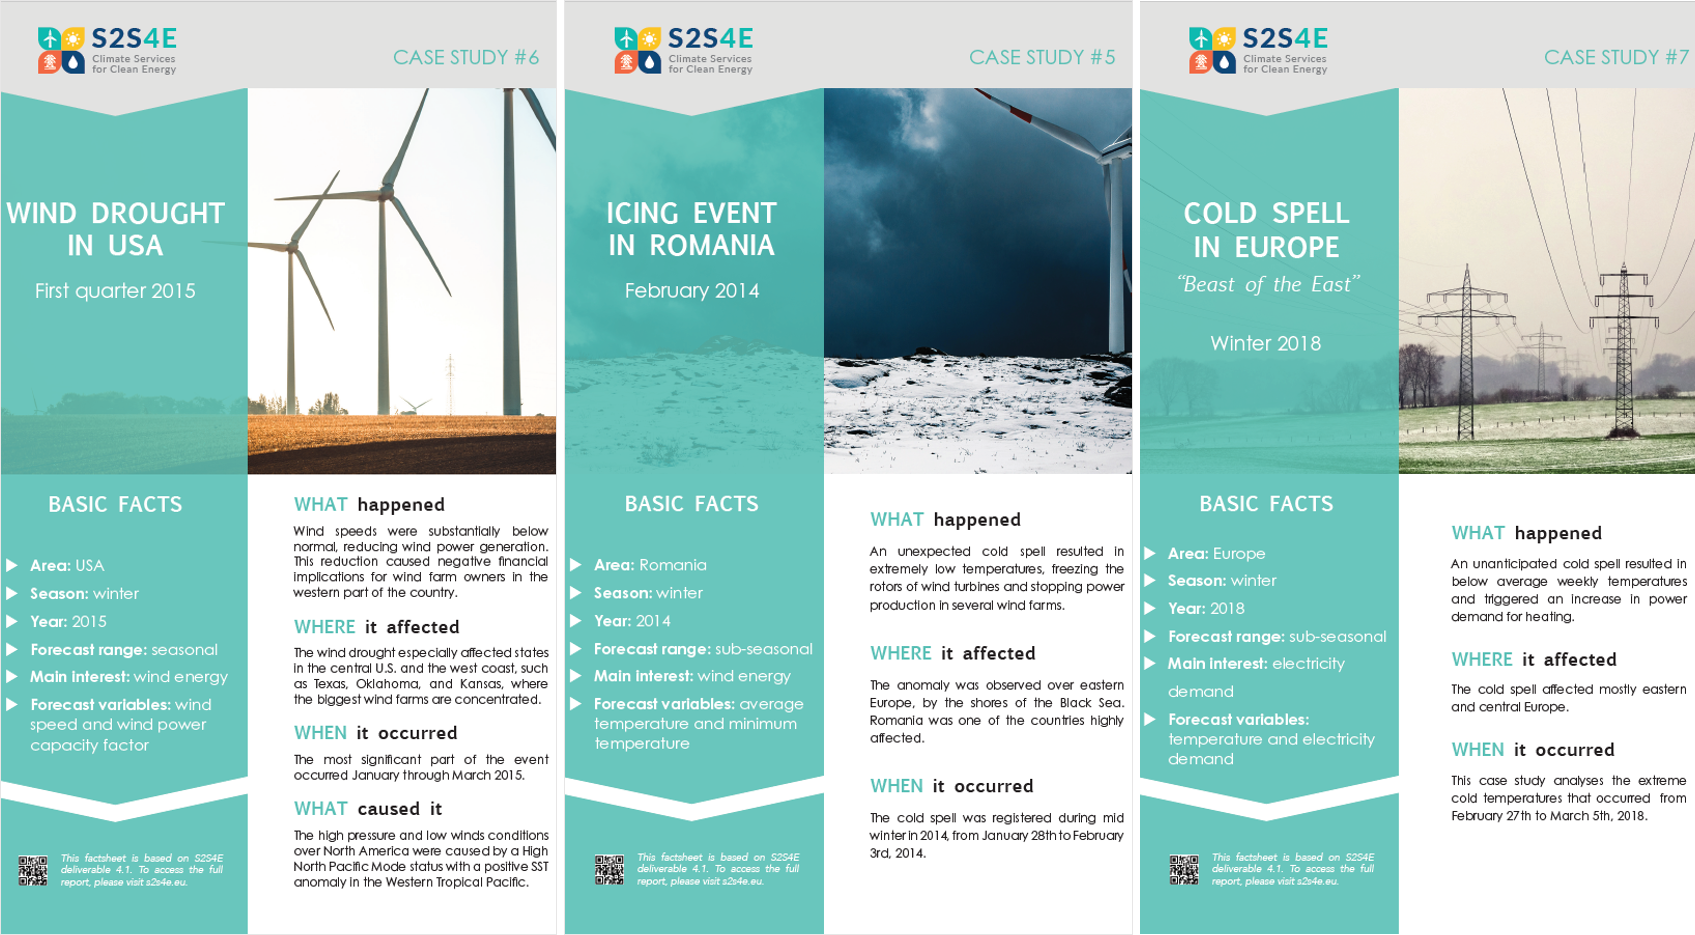
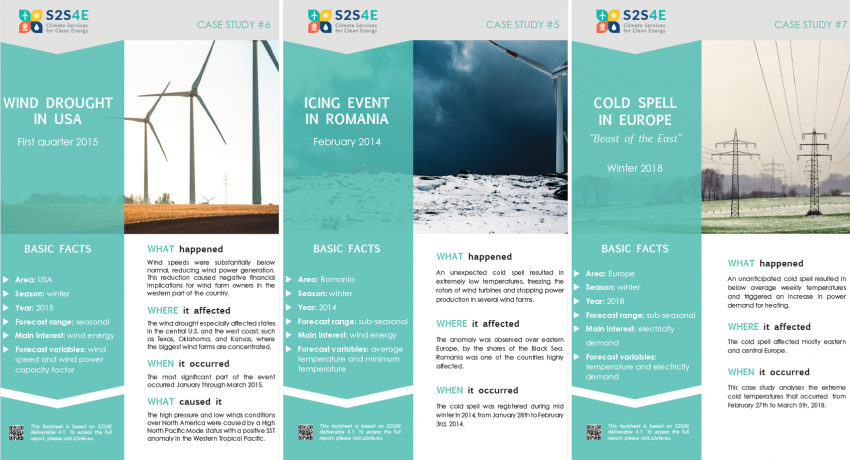
Due to the complex nature of these case studies, S2S4E has been motivated to create factsheets as an additional task for the project. These factsheets are intended to summarize the most important points of the case studies in a design document which we hope to appeal to wider, non-technical audiences.
The factsheets include an overview of the climate event in focus, a detailed description of the climate event by means of analysing reanalysis datasets, and an explanation of the S2S4E forecast available for the most relevant variables of the case study. Relevant skill scores are also presented to assess the quality of S2S forecasts. These case studies therefore provide in depth understanding of the S2S4E climate service application in the energy sector.
So far, factsheets 5, 6, and 7 have been created. More factsheets for the other five case studies will be presented in the next months.
A guide to help understand the scientific aspects of the factsheets and case studies
As an extra step to help readers understand the scientific components of the factsheets, a guide has been created, which is available here. This guide presents information on how to understand reanalysis time series and forecasts, how to interpret probabilistic forecast figures, and definitions of key terms used in the factsheets.
Written by Julia Cannata / BSC.