
With an increasing number of wind turbines, electricity demand spikes during cold and still winter weather could prove even more challenging for electricity producers. As part of the S2S4E project, we are working to improve week- to month-ahead forecasts of such events, writes Hannah Bloomfield from the University of Reading.
In winter, many Central and Northern European countries, including the UK, have a significantly higher electricity demand than they do in summer, due to an increased need for heating and lighting.
In past decades, meeting this increased demand was relatively easy, as electricity generation was supplied from a more “traditional” fleet of coal, gas, and oil-fired power stations. It is very easy to control when these types of generation are on or off, and they can be turned on very rapidly to meet a sudden increase in demand, which can occur for example when something really exciting comes on the TV.
In order to meet European governments’ carbon reduction targets, the type of generators that are used to meet demand is rapidly changing. A transition is underway to more renewable sources such as wind, solar and hydropower.
More weather-dependent power generation
The operation of the renewable generation is dependent on the present weather conditions. It is therefore important to understand how the power system’s present-day weather sensitivity is likely to change when more renewable generation is introduced.
Recent research from the energy-meteorology research group at the University of Reading has investigated various aspects of this problem, focussing on the UK power system. This has been done using weather-dependent models of demand and wind and solar power generation (available here if you’d like to have a play with the data).
A problem with using measured demand and renewable generation data for this type of analysis is that there are not very long time series of data available with the same amount of renewable generation installed – due to the rapid growth in wind and solar power – or with the same underlying level of demand.
We have therefore built reconstructions of a fixed power system configuration, based on data from 2017 for installed renewable generation and demand. We have then used a re-analysis dataset to reconstruct what the present-day power system would have looked like with the last 40 years of weather.
With these long datasets, we can look at the meteorological drivers of power systems and investigate thoroughly the changing weather conditions associated with extreme power system events as we put more renewables on the system. Some examples of this are discussed below.
Occurrence of demand spikes set to change
Figure 1 shows composites of the ten highest demand events experienced in the UK from 1980-2016. We see that if there is no renewable generation installed on the system, then peak demand events are associated with near-surface temperatures below freezing and moderately low winds.
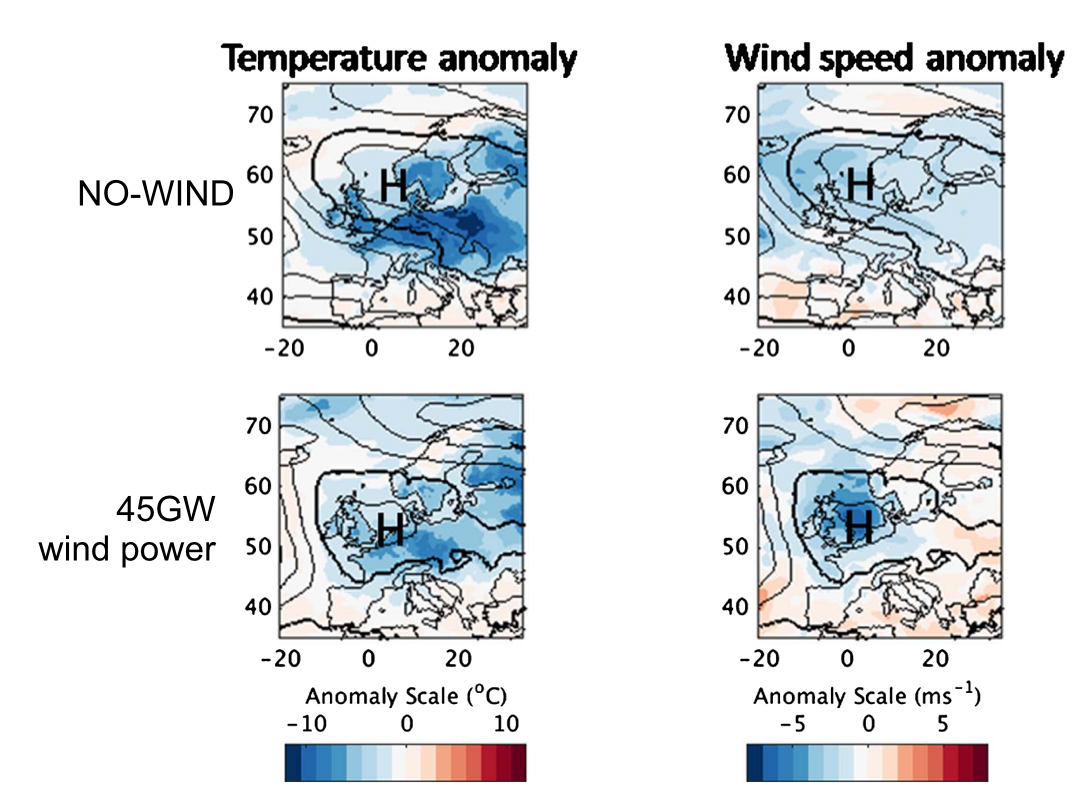
Figure 1: Anomaly composites of the ten most extreme peak load days (i.e. daily demand – wind power generation). These are given for temperatures (first column) and wind speeds (2nd column) measured at a height of two metres. The composites are made for two power system setups: A UK power system with no renewables (NO-WIND) and one with 45GW of installed wind power. Mean-sea-level-pressure contours for the events are overlaid in black. The thick contour is the same in each of the subplots. The ’H’ represents the location of the centre of the region of high pressure.
The key ingredient here is the location of a high-pressure system, with a strong pressure gradient over the UK bringing cold continental air from Central Europe.
If we were to look forward to planned, future power systems – where installed wind power capacity has doubled to 45 GW – then the weather conditions likely to cause the largest system stress are likely to change.
As we see in figure 1, peak demand events will still be associated with high pressure but there is a shift to high pressure events centred over the UK now being most important. Peak demands will still be associated with cold temperatures, but the most extreme events will be much stiller than previously seen when no wind power was installed.
Challenging to forecast demand spikes
It is relatively easy to forecast the human-induced demand for energy, as we all tend to go to work and take holiday at certain times of the day/year. It is, however, challenging to forecast the type of events shown in figure 1 at timescales greater than a few days.
If information was available at timescales of one week to one month ahead (what we scientists refer to as sub-seasonal timescales), then this would make it easier for power producers to make specific plans for where electricity is going to be sourced from to meet expected high demand events.
Studies have shown that forecasts for more than one week ahead tend to be more accurate when it comes to large-scale weather conditions than for more local surface anomalies.
Because of this, researchers involved in the S2S4E project have investigated the potential for two types of large-scale patterns to be used to provide information at sub-seasonal timescales for energy system resource planning.
Weather regimes and targeted circulation types
The first pattern-based method is weather regimes. These are patterns defined based on meteorological conditions (daily anomalies of 500hPa geopotential height, an atmospheric pressure level approximately 5km above sea level).
Each day during the extended winter season can be assigned into one of the following weather patterns: the positive and negative phase of the North Atlantic Oscillation (NAO+, NAO-), Scandinavian Blocking (ScBL) and the Atlantic Ridge (AR).
Rather than clustering on a large-scale field, the second method, newly developed for the project, is called Targeted Circulation Types. This assigns each day into one of four patterns based on surface energy data, using 28 countries across Europe. These are: Blocked (BL), Zonal (ZL), a European High (EuHi) and the European Trough (EuTr).
Each of these eight weather patterns can be associated with a set of surface meteorological impacts, meaning a set of demand, wind power or solar power anomalies.
Figure 2 shows the probability of demand being in the upper tercile (top 30%) while each of the patterns has occurred (again using our reanalysis-based power system data to get a longer record for analysis).
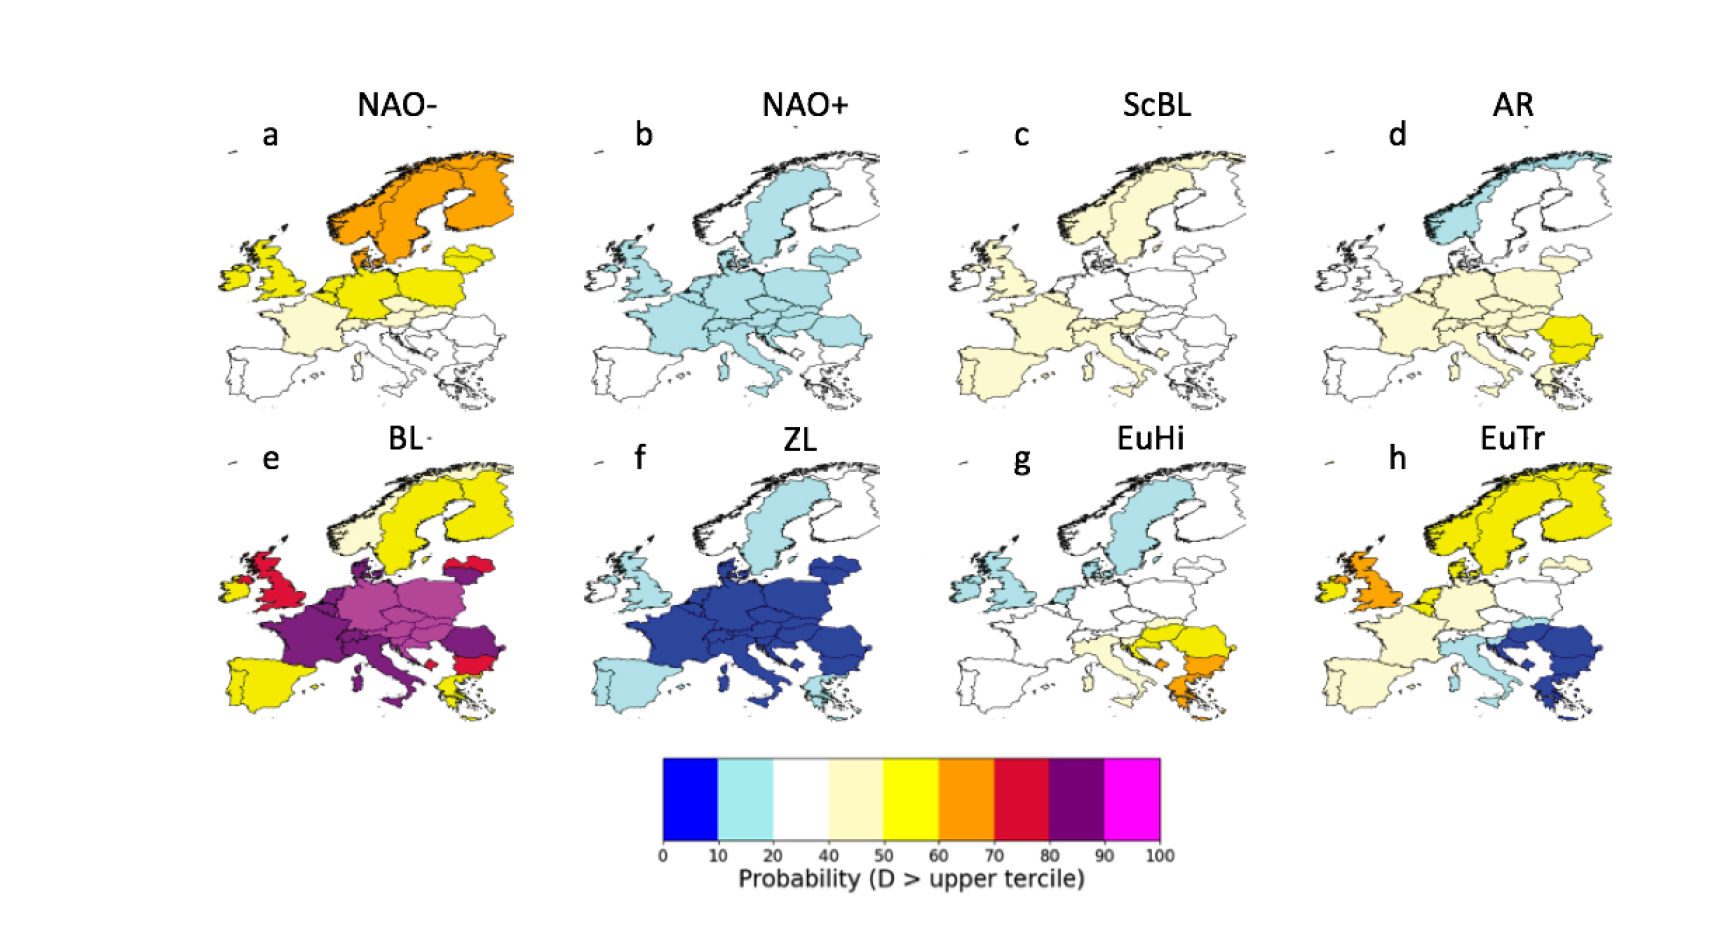
Figure 2: Probability of each country’s demand being in the upper climatological tercile of demand in each weather regime (top) and Targeted Circulation Type (bottom). The Targeted Circulation Type patterns used are constructed from normalised demand.
This shows that particular weather patterns are more likely to be associated with high demand events. For example, if you are in the Blocked (BL) TCT pattern, you have an 80% probability of being in the upper 33% of demand, whereas there is less than 10% probability of demand being high in the Zonal (ZL) pattern. As well as this, the link to energy demand is not as strong using weather regimes as using the Targeted Circulation Types.
S2S4E researchers are currently investigating if there is a trade-off in the levels of predictability associated with the two different types of patterns.
The predictability of the weather regimes at timescales of 1 – 4 weeks ahead is being compared to the predictability of the Targeted Circulation Types. These are being benchmarked against some common forecasting methods, such as a climatological forecast (i.e. assuming that this week will be similar to the average conditions based on past years observations) and a persistence forecast (i.e. assuming the present day conditions will persist into the future without changing).
Written by Hannah Bloomfield from the University of Reading. Edited by Iselin Rønningsbakk / CICERO Center for International Climate Research.
Sources:
• Bloomfield, H. C., Brayshaw, D. J. and Charlton-Perez, A. (2019) Characterising the winter meteorological drivers of the European electricity system using Targeted Circulation Types. Meteorological Applications. (In Press)
• van der Wiel, K., Bloomfield, H., Lee, R. W., Stoop, L., Blackport, R., Screen, J. and Selten, F. M. (2019) The influence of weather regimes on European renewable energy production and demand. Environmental Research Letters, 14. 094010.
• Bloomfield, H., Brayshaw, D. J., Shaffrey, L., Coker, P. J. and Thornton, H. E. (2018) The changing sensitivity of power systems to meteorological drivers: a case study of Great Britain. Environmental Research Letters, 13 (5). 054028.
• Bloomfield, H. C., Brayshaw, D. J., Shaffrey, L. C., Coker, P. J. and Thornton, H. E. (2016) Quantifying the increasing sensitivity of power systems to climate variability. Environmental Research Letters, 11 (12). 124025.
• Drew, D. R., Coker, P. J., Bloomfield, H. C., Brayshaw, D. J., Barlow, J. F. and Richards, A. (2019) Sunny windy Sundays. Renewable Energy, 138. pp. 870-875.
• White, C. J., Carlsen, H., Robertson, A. W., Klein, R. J., Lazo, J. K., Kumar, A., ... & Bharwani, S. (2017). Potential applications of subseasonal‐to‐seasonal (S2S) predictions. Meteorological applications, 24(3), 315-325.