This guide provides practical information to facilitate readers through the format and technical terminology of the S2S4E factsheets.
Introduction to S2S4E Factsheets
The S2S4E factsheets present summaries of the eight case studies that have been selected in the project to provide real-world examples of the potential benefits and drawbacks of the forecasts used in the Decision Support Tool (DST). The case studies present extreme events that occured in the past and evaluate S2S4E forecasts that potentially could have been available, to see if they could have added value to decision-making for the energy sector in preparation for these extreme events.
To support this proof of concept , the eight historical case studies have been selected as most relevant by industrial partners, due to unusual climate behaviour affecting the energy market. These case studies were originally identified in Deliverable 2.1, analysed from the climatological point of view in Deliverable 4.1 and these factsheets, and from the economic perspective in Deliverable 2.2.
How S2S4E factsheets are organized
The factsheets include an overview of the climate event in focus, a detailed description of the climate event by means of analysing reanalysis datasets, and an explanation of the S2S4E forecast available for the most relevant variables of the case study. Relevant skill scores are also presented to assess the quality of S2S forecasts. These case studies therefore provide in depth understanding of the S2S4E climate service application in the energy sector.
Understanding the reanalysis time series
In the “Analysis of the Event” sections of the factsheets, the climate conditions of each case study are presented. For this purpose, a reanalysis is used. As seen in Figures 1 and 2 below, a time series of climate variables of interest and a map of anomalies are analyzed. Both figures represent the climate anomalies that occurred. In Figure 1, the dark red and dark blue represent the areas with the most significant anomalies with respect to climatology.
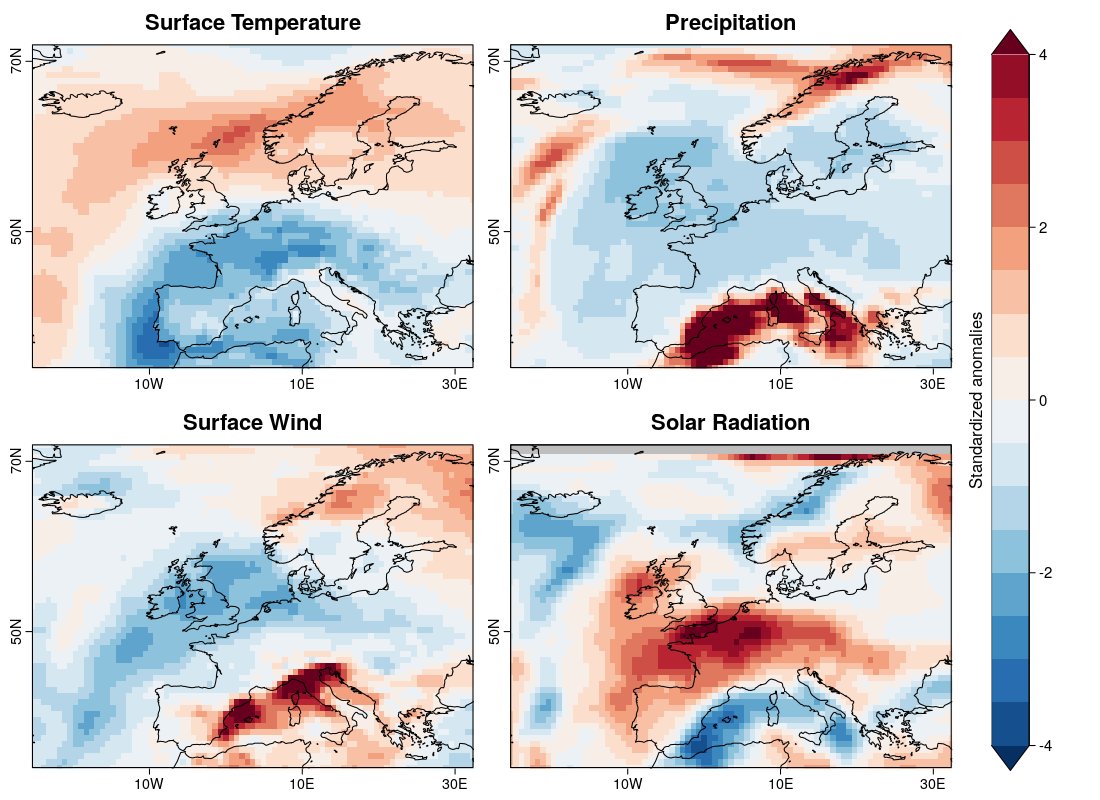
Figure 1: Standardized anomalies for temperature, precipitation, surface wind, and solar radiation
Figure 2 compares weekly climatology (1979-2017) to the observed conditions during the target period analyzed in the case study. The dark blue sections represent the normal conditions according to climatology (p33-p66: 33% to 66% percentiles of the climatological distribution). The light blue section represents above and below normal conditions of p66-P90 and P33-P10. The black dashed line represents the observed daily averages for the year in question and the solid, horizontal black lines represent the weekly mean . When the observed weekly mean is below or above the blue shading, it means that the variable (in this case temperature) is below or above the 10th or 90th percentile of climatology, and thus is an extreme value. For instance, in the week of January 17-24 in Figure 2, the observed weekly mean is well below p10, presenting a strong anomaly.
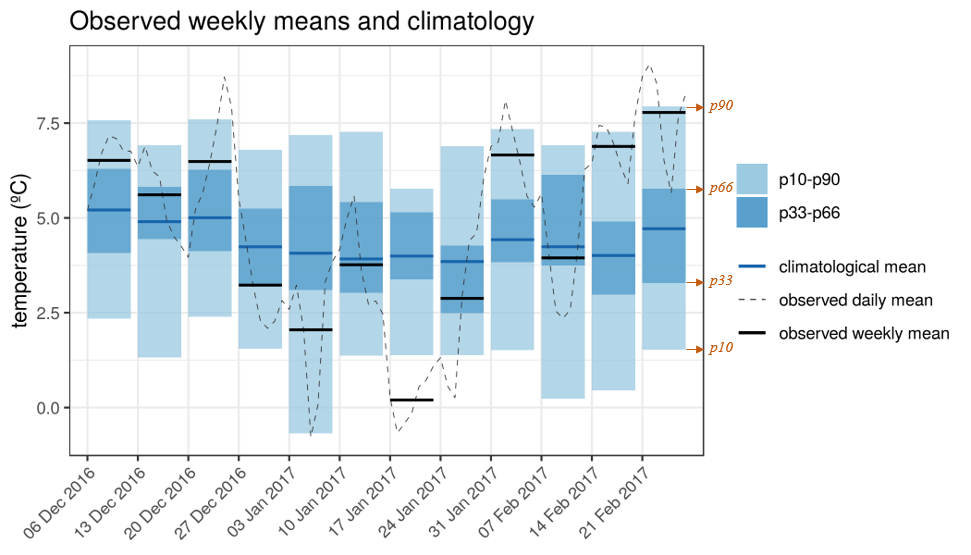
Figure 2: Observed weekly means and climatology
S2S4E Forecasts
In the “Available Forecasts” sections, S2S4E forecasts of the most relevant climate variables are presented as probability distribution functions (pdf) as shown in Figure 3 below. These forecasts analyze the same target time period, but with different lead times. Depending on the length of the anomaly analyzed, subseasonal or seasonal forecasts were studied. For example, if the anomaly occurred for only one week, sub-seasonal predictions were issued 4, 3, 2, and 1 week before the event. On the other hand, for climate anomalies of one month or more, seasonal predictions were issued 3, 2 and 1 month before the event of study.
In the forecast figures (Figure 3 below), ensemble members are shown as yellow dots which represent multiple possible evolutions of the atmosphere. The probability distribution function is divided into 3 parts: the above normal tercile, the normal tercile, and below normal tercile. The portion of ensemble members (to the total number of ensemble members) in each of these terciles corresponds to the forecasted probabilities of above normal, normal, and below normal conditions for the climate variable studied. For example, in Figure 3, the forecast issued two weeks before the event (days 12-18) illustrates a probability of 52% for the above normal tercile while the forecast issued one week later indicates a probability of 97%. As further explained in the figure, the extremes, considered as the probability of being below or above the 10th or 90th percentile of climatology, are represented as dashed red and blue lines.
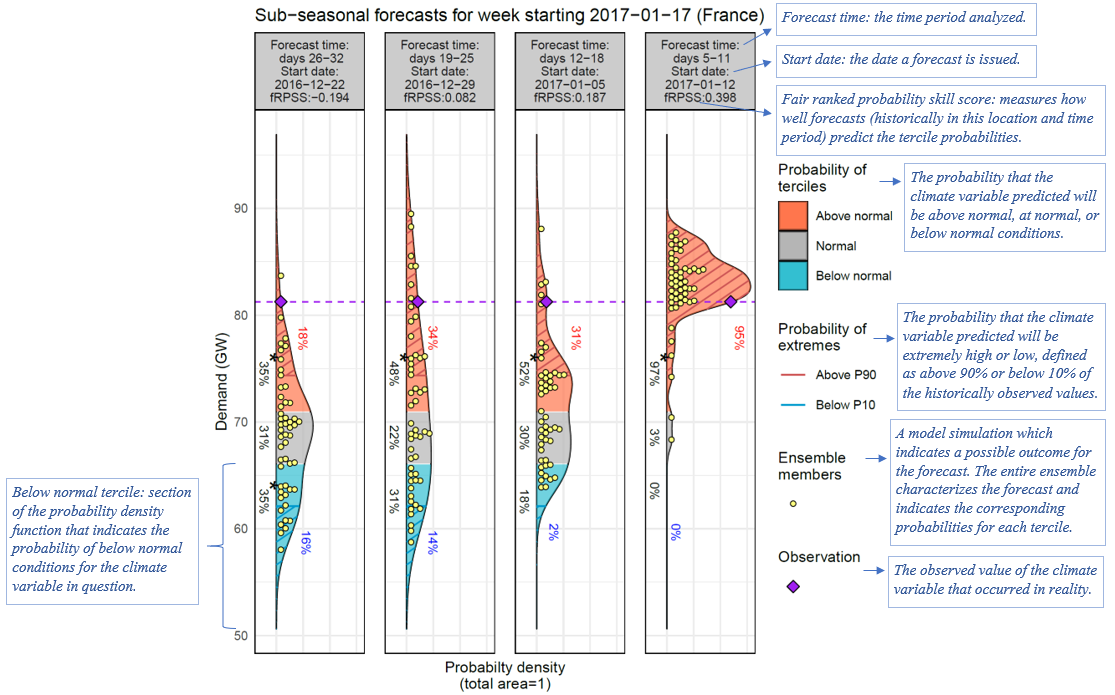
Figure 3: Probabilistic forecasts
How to interpret probabilistic forecasts
A probabilistic forecast is composed of several ensemble members to take into account uncertainties in the initial conditions and in the representation of the processes in the atmosphere. In this case, the probabilistic forecast predicts a probability of occurrence for each tercile (i.e. for the situation described by each tercile: below normal, normal or above normal conditions). A probability above 0% for a certain tercile indicates that there are chances that tercile will happen. The higher the probability the higher the chances. Higher probability indicates that the model has more certainty on the predicted outcome, due to more predictable atmospheric conditions.
A probability forecast cannot be evaluated from a single case, but from a high enough number of cases. So how does one analyze a forecast and determine if the forecast has value for decision-making? As implied in previous sections, the skill of the forecasts is key. The skill score associated to a forecast is computed from past predictions and gives information of its performance over a sufficiently long series of years. It is important therefore to note that forecasts with high skill scores are very likely to predict the correct above, normal, or below normal conditions that will occur in reality
As further described in the definition of skill below, skills scores greater than 0 represents a forecast which historically performs better than climatology at predicting the correct tercile. A skill score below 0 is therefore defined as unskilful and a score of 0 is equal to the climatological forecast. To further define the relative value of these skill scores, the skill scores have been categorized as “fair, good, very good” in the Decision Support Tool. The thresholds for these relative descriptions are as follows:
0 < Fair <0.15
0.15 < Good <0.30
0.30 < Very Good
To summarise, when analyzing a probabilistic forecast, there are two important indicators, the forecast probability and the skill score. The forecast probability indicates how certain the model is based on the spread of its members for that particular moment while the skill score indicates how well the model has performed for that region and time of year based on past predictions.
Frequently Used Terms
The terms listed below are frequently used in the S2S4E factsheets. The definitions specifically consider how these terms are used in the context of the factsheets.
Anomalies: describes conditions that differ significantly from the normal state for the period of time in question. In other words, a deviation from the normal conditions (below or above) where the normal conditions are defined by the climatology for that region and time of the year.
Climatology: refers to the historical normal conditions of a climate variable for a region and time of the year. Climatology is based on the mean conditions for a sufficiently long time period computed from the reanalysis.
Capacity factor: a widespread indicator in the energy sector that allows fair comparisons between power plants of different sizes. For a given period of time, it is calculated dividing the produced generation by the maximum production that would be achieved if the plant was operating at full capacity during the entire time.
IEC 1, 2, 3: a classification of wind turbines according to their suitability for high, medium or low wind speed conditions, as defined in the IEC-61400-2 international standard.
Ensemble: A collection of model simulations that aim to give an indication of the range of possible future outcomes of a simulation. Uncertainties in the initial conditions and model formulations are represented by different ensemble members, which indicate the probability range of a forecast. The multiple simulations are conducted to account for the two usual sources of uncertainty in forecast models: (1) the errors introduced by the use of imperfect initial conditions, amplified by the chaotic nature of the evolution equations of the atmosphere, which is often referred to as sensitive dependence on initial conditions; and (2) errors introduced because of imperfections in the model formulation, such as the approximate mathematical methods to solve the equations.
Extreme event (p90 and p10): when an event occurs above or below the 90% highest or 10% lowest historical observed values of that variable. These 90% and 10% threshold are marked in the forecast figures as P90 and P10.
Note: Specific skill scores for p90 and p10 are in Deliverable 4.1
Extremely above (or below) normal: a synonym for “extreme event”, taking into account the 10th and 90th percentiles.
Lead time: The time in advance a forecast is issued. For example, a forecast with a two week lead time is a prediction two weeks before the event in study occurs.
Reanalysis: A reanalysis is a combination of a numerical model with observations that provides a coherent estimate of past climate conditions. The climate conditions of the year in study are compared to climatology.
Skill score: Refers to the accuracy of the forecast. A relative measure of the quality of the forecasting system compared to a reference forecast (climatology). It is computed by assessing how well the model performed for the same lead time, date and location in the past. A skill score below 0 is defined as unskilful, a score of 0 is equal to the climatological forecast, and anything above 0 is an improvement compared to climatology.
FairRPSS (Fair Ranked Probability Skill Score): A type of skill score that measures how well a forecast predicts the correct terciles probabilities. In other words, a fRPSS greater than 0, represents a forecast which historically performs better than climatology at predicting the correct terciles probabilities.
BSS (Brier Skill Score) for p10 and p90 (BS P10 and BSP90): A type of skill core that measures how well a forecast predicts the probability of the P10 and P90 extremes (see “extreme event” definition above). As in fRPSS and other skill scores, the Brier Skills Scores measure the performance for a period in the past.
Tercile: As shown in the probability density curve, forecasts provide probabilities for three categories, named terciles. These three terciles represent below normal, normal and above normal conditions, based on a past reference period. The forecasted probability of each tercile corresponds to the percentage of ensemble members predicting below normal, normal or above normal conditions. A forecast reflecting climatology would predict a probability of 33.3% for each tercile, while a percentage greater or less than 33.3% represents a forecast with different conditions than climatology. For example, a temperature forecast with a probability of 43% for the above normal tercile, indicates greater chances for higher temperatures (compared to climatology).